Mapping Anchorage Island in the Suwarrow Atoll

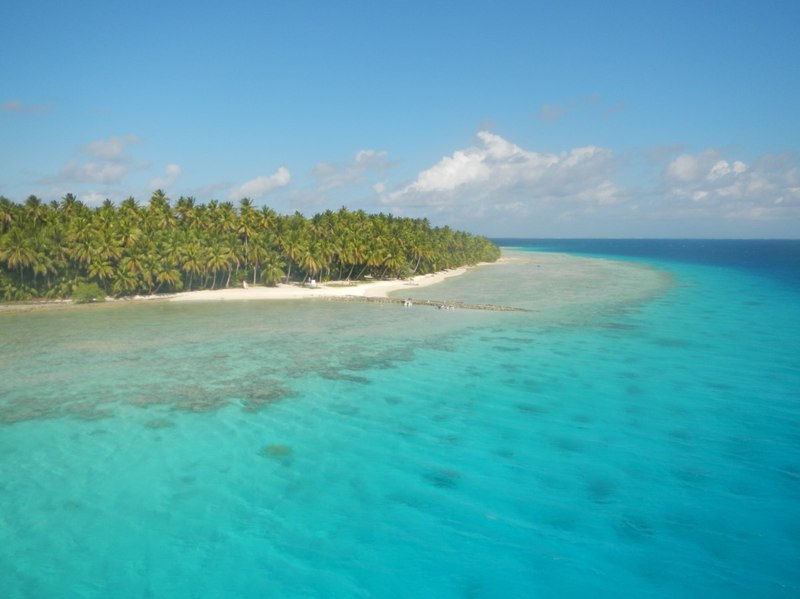
We are anchored at Suwarrow, an atoll in the South Pacific, that has some small islands sticking out inside its lagoon. The biggest of these islands is is called "Anchorage Island" (because the visiting boats anchor here). A few days ago I did a little project for math class: I created a map of the island and of the anchorage. It was a cool project and I want to write about how I did it.
To create the map of the island we first spent some time planning how we were going to do this. We thought the best way to get an accurate map would be to measure latitude and longitude at some points around the Island's outside which we would then transfer on a grid on a piece of paper. By connecting those points on the paper we would then get an outline of the island.
To measure latitude and longitude on the island we decided to use a little hand-held GPS. We could also have used a sextant and a compass but that would have been too complicated and not as accurate.
Next we thought about at what points of the island to measure latitude and longitude (that's called "taking a fix"). We drew a simple sketch of how we thought the island would roughly look at (kind of a baguette shape) and then marked the extreme end points along the baguettes's long and the narrow axis, and also marked a few landmarks for which we wanted to take latitude and longitude fixes (like the hut where the two National Park rangers on the island live). We thought that we would decide on additional points to take fixes of when we were on the island.
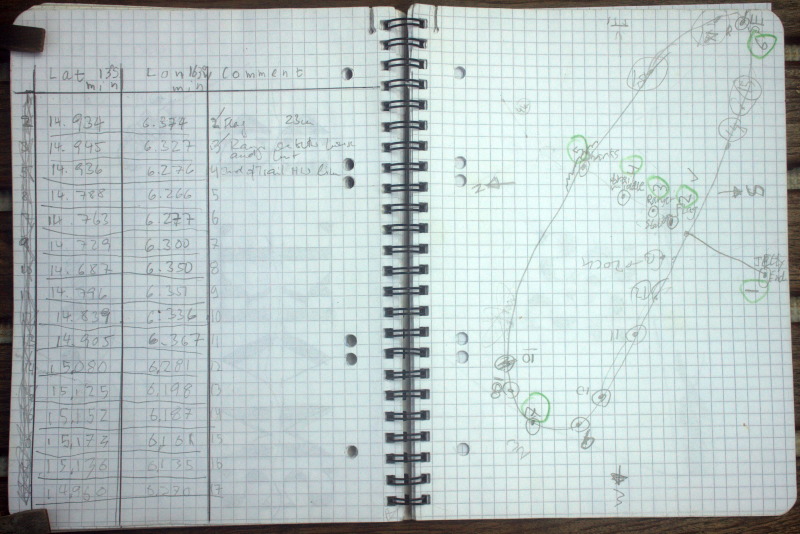
The next step was preparation for actually taking the fixes on the island. I numbered the points we had marked on the little "baguette sketch" and then cerated a table with one column for latitude and one column for longitude for each of the points. I also added a column for comments (in case we needed to note something special for a fix) and left enough space for adding other points. Then we thought about how to record latitude and longitude values. These are measured in degrees, minutes, and fractions of a minute. For example, our boat is currently anchored at
latitude:    13 degrees 14.906 minutes South
longitude:  163 degrees 06.463 minutes West
The "South" and "West" tells you that these are negative numbers. "South" latitudes get bigger as you go further down (south) on a map (like negative numbers the vertical axis on a grid) and "West" longitudes get bigger as you go further left (west) on a map (again like negative numbers on the horizontal axis of a grid). One degree of latitude is a long distance (about 100km), much longer than the little island I was going to map. So we realized that we only needed to write down the minutes-part of each fix because the degrees would be the same for all the fixes on the island (always 13 degrees South and 163 degrees West).
 Table to capture data and planning sketch ("baguette sketch")
The last thing we did in preparation was to charge the batteries for the GPS and I had to figure out how the GPS worked (which was quite easy).
Now we were ready to actually collect our data - that is to take and record the fixes around the island. We took our dinghy to the island and then started walking around the island. Whenever we came to a spot that I had marked on my "baguette sketch", I would read the latitude and longitude minutes off the GPS and my dad would write down the numbers in the table I had prepared (later we switched and he took the GPS and I would write down the numbers). We also looked carefully where the perimeter of the island changed direction and took additional fixes at those points. This would help us later to get all the little "bumps" and "dents" around the island (those parts that didn't look like the simple baguette shape I had sketched earlier when we were planning how to map the island). We also found some additional land marks that we took fixes of (like a little stone with something written on it about a Russian boat that had come here a long time ago). When taking the fixes we were careful to check the accuracy of the GPS (it shows you by how many meters a fix might be wrong). We were careful to always have the GPS track enough satellites to give us 10-15m accuracy.
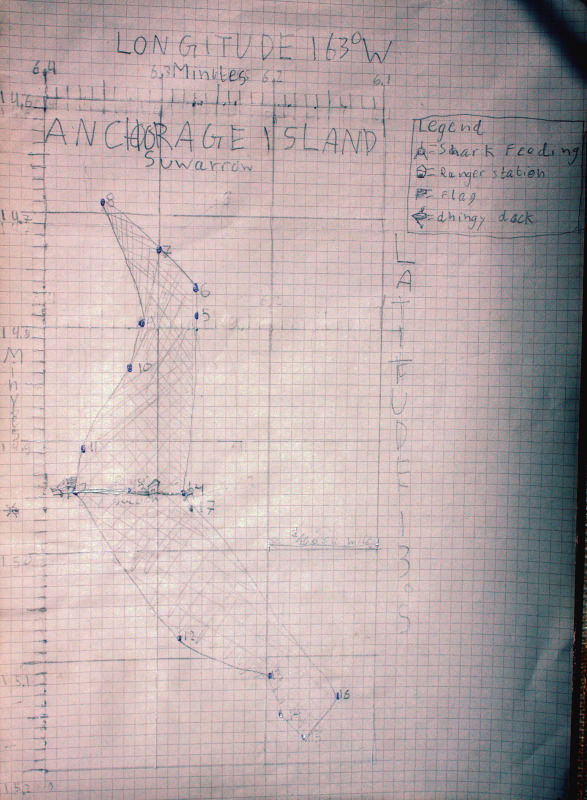
Finally, after we had taken all the fixes, we went back to our boat and I started drawing the map. First I had to figure out a scale at which to draw the map. I was using gridded paper with little 1/2 cm squares. This paper has about 60 squares along its long side and 40 squares along its narrow side. To leave some space (for titles, legend, labels, etc.) we would use only 40 x 30 squares. Then I looked for the biggest and the smallest number among all the latitudes we had recorded. The difference between those two values was 0.400 minutes which we called "400 units". We had 40 squares to fit those 400 units into. So each square would be equal to 10 units (which was 0.010 minutes of latitude). I did the same figuring with the longitude values which came out to the same scale (that is 0.010 degrees of longitude per square along the narrow side of my gridded paper).
Next I drew a grid at this scale, labeled the latitude and longitude axes, and then transferred the fixes from my table to the grid. I had to be careful to remember that all the values were negative numbers, so the bigger numbers would go further down (for latitude) and left (for longitude). After I had transferred and checked all the fixes (we had taken 18 fixes overall), I connected the dots and - voila! - there was the outline of Anchorage Island. It turned out not to look like a baguette but has a little kink in it, making it look a bit L-shaped - maybe more like a banana.
As a last step, I added a title, a legend and a scale to my map of Anchorage Island.
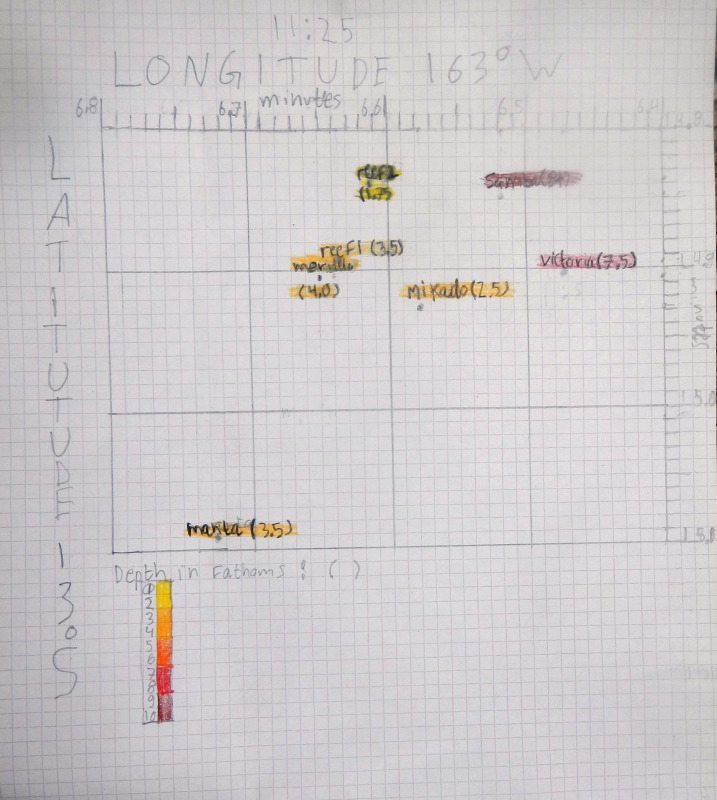
To create a map of the anchorage, we followed the same steps as for creating the map of the island. The only changes were that we had to go around by dinghy to get the positions of the different boats in the anchorage and that we also took depth measurements (called "soundings") at each boat with a lead-line. Later, when drawing the map I used different colors to show the depths on the map (going from light-yellow for very shallow to dark-red for very deep). We could have also taken altitude measurements on the island but it is very flat.
The most difficult parts in creating these maps were:
- Figuring out the scale, that is how many units (0.001 minutes of latitude and longitude) to use per square (because it's a bit complicated)
- Transferring the fixes correctly (because each point has lots of digits, you need to think about which way negative values go and because it's difficult to find the correct latitude and longitude in the middle of the grid, away from the axes)
- When we charted the anchorage taking the data was difficult because the dinghy was drifting and we also had to take depth measurements (and we had Niclas and Hannes from Victoria helping, so we had more people to coordinate) The most fun parts of doing the maps were...
- Taking the GPS fixes
- Connecting the dots to get the map
- Coloring in the different depths in the anchorage chart
What I would do differently if I were to do it again
- Take more depth measurements
- Anchor the dinghy when taking the measurements
- Label the axes on either side (and maybe even in the middle) to make it easier to transfer the points correctly
Useful things I learned :
- The different depths in the anchorage
- How to draw a grid at the right scale
- How to draw GPS points on the grid
- It's a good idea to work very neatly because it makes it easier
- It's important to double check your work after each major step

